Urban Biodiversity Intelligence

Pixel-Level
Biodiversity & Heat Stress
Intelligence

Multi-sensor satellite analytics at 10 m resolution. TNFD-ready reports in 48 hours. The only platform combining urban BDI with heat stress — academically validated.

Sentinel-1/2 · MODIS · ERA5-Land TNFD-aligned · CSRD · ESRS E4 UR Kraków · AGH · ESA Copernicus
9.0 km²
Pilot area analyzed
Kraków urban campus
139,795
Pixels processed
10 m × 10 m resolution
6
Sensor streams integrated
Sentinel · MODIS · ERA5 · SRTM
48h
End-to-end delivery
Request → TNFD-ready report

Europe Is Being Forced
to Measure What It Never Measured

Regulatory mandates are converging. The biodiversity data market is growing 120% annually. Companies that measure now build a structural competitive advantage.

1,200+

Companies adopted TNFD reporting

By early 2026, over 1,200 organisations globally aligned with TNFD recommendations — moving from voluntary to regulatory mandate ahead of COP17.

source: TNFD Global · tnfd.global
$69B

Projected biodiversity market by 2030

The global biodiversity market exceeded $2B in cumulative transactions in 2025, growing ~120% annually since 2023. Biodiversity data providers are the fastest-growing segment.

source: Sustainability Atlas · Biodiversity Credit Alliance
20%

EU ecosystems must be restored by 2030

The EU Nature Restoration Law mandates 20% of degraded land and marine ecosystems restored by 2030. Cities are on the measurement frontline — with no adequate urban tools until now.

source: EU Nature Restoration Law · European Commission
REGULATORY DEADLINES ›
2025 — CSRD reports (large companies, FY2024)
Oct 2026 — TNFD COP17 technical finalization
2026 — CSRD reports (mid-size companies, FY2025)
2030 — EU 20% restoration target

From Raw Satellite Data
to TNFD-Ready Report

📡

Ingest

Sentinel-1 SAR + Sentinel-2 optical + MODIS phenology + ERA5-Land thermal — all via Google Earth Engine. Zero raw data cost.

6 streams · free open data
🧮

Compute

BDI formula with 6 weighted components: NDVI (0.25) · Spectral CV (0.20) · Thermal Comfort (0.15) · Texture (0.15) · Geometry (0.15) · SAR (0.10).

10 m resolution · 139,795 px

Verify

Human-in-the-Loop expert validation via multi-agent AWS architecture with Claude Sonnet. Academic sign-off on every report — critical for regulatory acceptance.

TNFD-compliant · CSRD-aligned
📋

Deliver

Interactive BDI dashboard + TNFD-ready PDF report + heat stress overlay. Export in GeoTIFF, JSON, PDF. Ask our AI agent any follow-up question.

48h end-to-end

Four Business Models,
One Validated Platform

From heat-stress consulting to TNFD compliance and SaaS dashboards — built on the same reproducible BDI pipeline with zero raw data cost.

🌡️

Heat Stress & Urban Heat Island Audit

LST + UHI + heat-wave analysis at 10 m resolution for municipalities, logistics operators and retail ESG teams. Where in your real estate portfolio is critical thermal exposure?

From €8,000 · Solo-deliverable
📊

TNFD / CSRD Compliance Reporting

Ready-to-submit LEAP reports (Locate · Evaluate · Assess · Prepare) for banks, insurers and real estate funds. Aligned with ESRS E4 and TNFD v1.0. The hottest regulatory market in EU.

€12–50K per report · CSRD 2025–2027
🗺️

Urban Biodiversity SaaS Dashboard

Subscription access to live BDI maps, change detection and what-if scenarios. Built for municipal planners, landscape architects and developers.

From €490/month · Coming Q3 2026
🌿

Smart Green Infrastructure Planning

What-if digital twin: "Plant 50 trees here — how does BDI and LST change?" Interactive simulator for urban planners and architects. Aligned with Horizon Europe Mission Climate-Neutral Cities.

Grant-eligible · Horizon Europe
🔬

BDI Formula: Reproducible Methodology

Documented BDI formula with 6 weighted components, run on free Sentinel/MODIS/ERA5 data via Google Earth Engine. Zero raw data costs. Published methodology available for licensing.

Licensable · Academic-validated

Biodiversity Data API

Pass coordinates, receive BDI metrics as JSON. Pay-per-call model for ESG platform developers, PropTech and GIS vendors who need urban biodiversity data programmatically.

Pay-per-call · REST API · Roadmap 2026
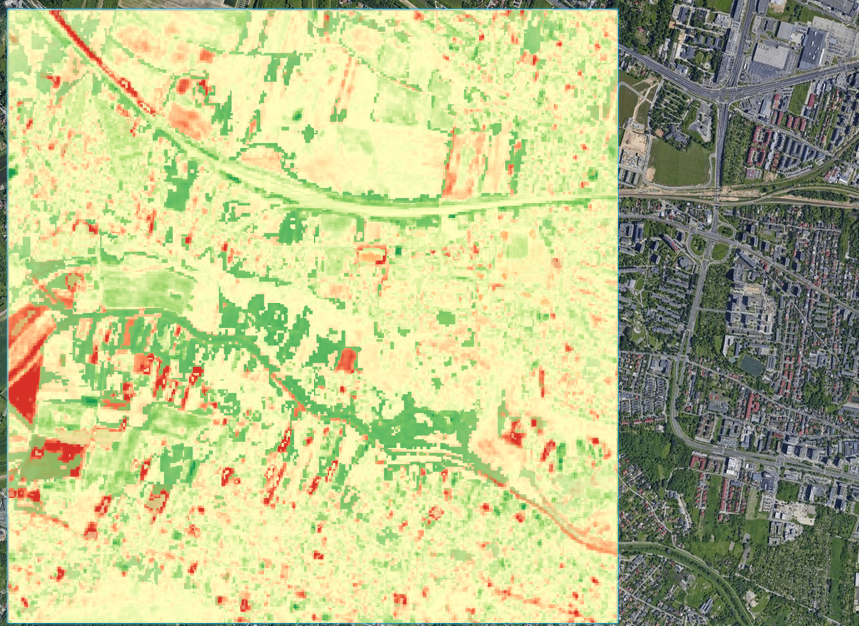
Biodiversity Index (BDI) map — Kraków 3×3 km, 2024

Fig. 19 — Biodiversity Index (BDI), Kraków study area 3×3 km, 10 m resolution, 2024. Color ramp: indigo (sealed, BDI <0.30) → cyan (urban park, 0.30–0.45) → light green (ecotone, 0.45–0.60) → dark green (forest core, 0.60–0.75). No pixels detected above BDI 0.80.

Kraków Pilot · UR Kraków / AGH · 2024

What 9.1 Hectares Tell Us
About Urban Biodiversity Collapse

The pilot analyzed 9.0 km² of Kraków urban campus across 2020–2024 using 6 satellite sensor streams. Results documented in peer-reviewed methodology and available as a downloadable case study.

  • 35.1%
    Biodiversity desert (BDI < 0.45)

    More than a third of the campus shows critically low BDI — sealed surfaces, sparse vegetation, degraded green corridors.

  • 8.8%
    High-value BDI zones (>0.65) — only 9.1 ha

    The entire urban ecosystem depends on a tiny 9.1 ha of high-BDI patches. Loss of any single patch triggers cascade fragmentation.

  • +3.59°C
    Spring temperature anomaly (MODIS LST)

    A +3.59°C spring surface temperature anomaly — directly correlated with low-BDI zones (r = −0.78).

  • 0.80
    Urban stress cap — no pixels exceed BDI 0.80

    Despite adjacent forest areas, cumulative urban thermal load and fragmentation systematically suppress biodiversity potential below the maximum achievable for this climate zone.

Chapter XIII — Management Proposals

Four priority interventions derived from the BDI analysis, ranked by irreversibility of the underlying loss.

PRIORITY 01 · PROTECTION

Absolute protection of the forest core

The <10 ha high-BDI zone (>0.65) requires absolute protection. Any reduction constitutes irreversible loss — no compensation is possible elsewhere in the urban matrix.

Non-negotiable · 9.1 ha at risk
PRIORITY 02 · BUFFER

Ecotone zone management (BDI 0.50–0.55)

The transition zone between urban park and forest core is the most vulnerable component. Enhanced management prevents downward migration into the low-BDI class.

Ecotone buffer · High urgency
PRIORITY 03 · RETROFITTING

Green infrastructure in the 35% low-BDI area

Green roofs, vertical gardens, urban orchards, and permeable surfaces in the sealed urban fabric can raise BDI above 0.45 and restore connectivity between fragments.

Urban retrofit · Horizon Europe eligible
PRIORITY 04 · ML OPTIMISATION

Stepping-stone site selection via ML

Random forest classifiers applied to the BDI+MESH connectivity index identify the exact pixels where targeted planting maximises landscape-scale biodiversity gain per euro invested.

AI-assisted · MESH index

"The BDI framework successfully integrated optical, thermal, radar and phenological data into a single mechanistically justified assessment tool. The pronounced bimodality revealed genuine ecological discontinuity in the urban landscape — distinguishing generalist-supporting urban matrices from specialist-supporting forest cores. The absence of BDI values above 0.80 quantified, for the first time, the cumulative suppression of biodiversity potential by urban stressors."

— Chapter XIII Conclusion · BDI Integrated Assessment · UR Kraków / AGH · 2024
Pixel-Level Findings from
the Kraków Research Pilot

Every metric is reproducible — derived from open Sentinel and MODIS archives, documented chapter by chapter in the peer-reviewed methodology.

BDI DISTRIBUTION · 139,795 PIXELS · KRAKÓW 2024 0.0 0.50 1.0 0.45 0.65 mean 0.42 LOW BDI · 35.1% MID · 56.1% HIGH · 8.8% Formula: NDVI×0.25 + CV×0.20 + LST_inv×0.15 + Texture×0.15 + Geometry×0.15 + SAR×0.10
Chapter XIII · BDI Calculation 2024

Bimodal Distribution Reveals Two Ecosystems in Collision

The BDI formula applied across 139,795 pixels produces a characteristic bimodal curve. One peak at BDI 0.438 marks the urban park fringe — stressed and fragmented. A second peak at 0.695 marks the forest core — the last intact refuge. No pixels cross the 0.80 threshold, indicating that cumulative urban stress caps ecological recovery across the entire campus. The gap between the two peaks is where urban biodiversity is being silently lost.

35.1% Low BDI · <0.45
0.42 Mean BDI · below EU 0.50
9.1 ha High-value zone · >0.65
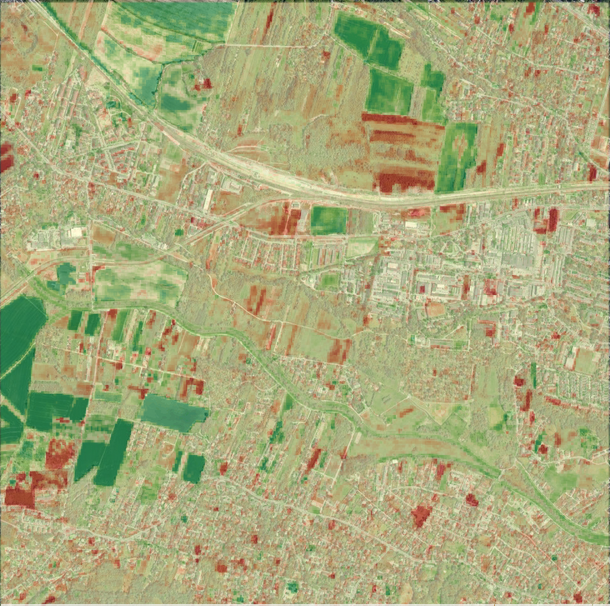
Change Detection ΔNDVI 2020–2024 · Sentinel-2 · Kraków
Chapter XII · Change Detection 2020–2024

7.2 Hectares Sealed in Four Years — Detected at 10 m

Sentinel-2 NDVI delta analysis across the 4-year window shows a campus losing ground at 1.8 ha/year. 26.3% of pixels show measurable degradation (ΔNDVI < −0.12). New sealed surfaces — identified via SAR backscatter shift combined with NDVI collapse — account for 7.2 ha of permanent land-use conversion. Meanwhile, 11.4 ha of previously stressed zones showed vegetation recovery, demonstrating that reversal is possible where pressure is removed.

7.2 ha New sealed surface
11.4 ha Vegetation recovery
26.3% Degraded pixels

"Cities are losing their last biodiversity refuges to sealed surfaces faster than anyone can measure with conventional tools. Our analysis shows 26.3% of the Kraków campus degraded in just four years — with no prior pixel-level evidence available."

— MOSAIK Earth · Kraków Urban Campus Research Pilot · 2024
SURFACE TEMPERATURE ANOMALY · ERA5-LAND + MODIS LST 22.4°C 37°C 52.8°C +1° +2° +3° +4° 2020 2021 2022 2023 2024 +3.59°C Spring surface temp anomaly vs 2000–2020 baseline Heat wave days/year · 2020: 8d → 2024: 14d r(BDI↔LST) = −0.78
Chapter XI · Thermal & Heat Stress 2022–2024

+3.59°C Spring Anomaly Confirms BDI↔Heat Correlation

ERA5-Land air temperature records and MODIS LST data document a persistent warming trend reaching +3.59°C above the 2000–2020 spring baseline in 2024. Surface temperatures peak at 52.8°C in sealed low-BDI zones. Heat wave days (LST >35°C) increased from 8 to 14 per year over the study period. Crucially, UHI hotspots map directly onto low-BDI zones — the BDI↔LST correlation coefficient is −0.78 — proving that biodiversity loss and thermal risk are two names for the same problem.

+3.59°C Spring anomaly 2024
52.8°C Peak LST recorded
−0.78 BDI↔LST correlation

Try Our BDI Intelligence Agent

Ask the agent to analyse biodiversity, heat stress or run a TNFD LEAP report for any European city.

🛰
MOSAIK BDI Agent
● Ready · GEE pipeline active
WebSocket: disconnected
BDI
Hello! 🛰 I'm MOSAIK's BDI Agent. Ask me to compute biodiversity index, heat stress analysis, TNFD LEAP report or change detection — I'll run the GEE pipeline and return results.
just now
Running GEE pipeline…

Book a Discovery Call

Ready to see MOSAIK applied to your portfolio or city? Let's talk about a custom pilot.

Email us directly
hello@mosaik.earth

The first 10 pilot partners join on joint-research terms, in exchange for detailed feedback.

UR Kraków AGH University ESA Copernicus EEA TNFD Forum Google Earth Engine AWS Activate Horizon Europe

Multi-Agent Architectures
of Agentic AI

For forecasting biodiversity in urban areas: simplified architecture of sequential agent chains for evaluating the effectiveness of fundamental models, hierarchical architecture of Human-in-the-Loop smart specialisation using vector and structured databases, Centralised Shared Tool API architecture for intellectual assessment of biodiversity using Landsat-8, Sentinel-2, MODIS and ERA5-Land satellite datasets, Sequential Agent Chains architecture.

Supervisor Agent
Domain Coordinators
Worker Agents
Knowledge Bases & External Resources
Foundation Model · Global Compliance
Regulatory Control Loop
Regulatory Domain Coordinator
Worker Agent
Worker Agent
Knowledge Base
Titan Text Embeddings v2 · Vector Store
Structured Data Source
Action Group · Amazon Redshift
Claude 3.5 Sonnet v2
Human-in-the-Loop
Expected answer → Connect → Expert → Confirmed Response
Satellite Control Loop
Domain Coordinator
Landsat-8 Agent
Sentinel-2 Agent
MODIS Agent
ERA5-Land Agent
Tool APIs · Google Earth Engine
AWS · Satellite Group
🛰 Landsat-8 · Sentinel-2 · MODIS · ERA5-Land
Claude 3.5 Sonnet v2
Finance & Risk Control Loop
Domain Coordinator
Worker Agent
AWS Lambda Calculations
AWS Lambda Diagram
Claude 3.5 Sonnet v2
Energy Control Loop
· · · · ·
· · · · ·
· · · · ·
Fundamental Model Selection
Worker Agent
Expected answer
Claude 3.5 Nova Pro 1.0 v1 gpt-oss-20t Llama 3.2 3B v1 DeepSeek-R1 v1

Compliance Distribution

General view of the multi-agent hierarchical architecture for forecasting biodiversity in urban areas with compliance distribution and possible levels of responsibility, using the example of institutions in Poland.

City-level compliance
Regional compliance
Global compliance
City-level compliance
City customer
Regional compliance
Institute of Geophysics, PAN
Institute of Geography and Spatial Organization PAN
AGH University of Kraków
Uniwersytet Rolniczy im. Hugona Kołłątaja
Global compliance
European Space Agency
European Centre for Medium-Range Weather Forecasts
European Environment Agency
European Organisation for the Exploitation of Meteorological Satellites
🤖
Supervisor Agent
Biodiversity Supervisor Agent
🧠
Domain Coordinators
Domain Coordinators
⚙️
Worker Agents
Worker Agents
📚
Knowledge Bases & Resources
Knowledge Bases
Satellite
Equipment
Machines